Quality Common Scoring

Providing feedback on inspections
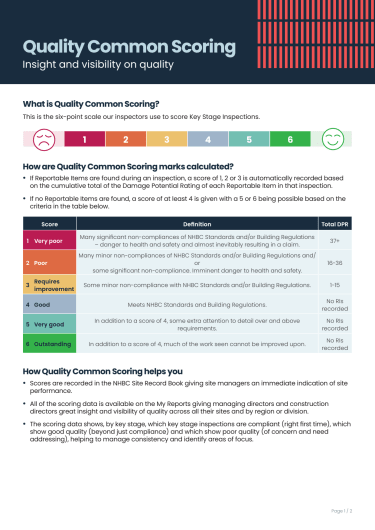
Applied to all Key Stage and Risk Based Inspections, this is the same scoring we use for Construction Quality Reviews. Scores are 1-6 where 4 indicates compliance with NHBC Standards, 1 is very poor and 6 is outstanding work.
Managing Directors and Construction Directors can now access the Quality Common Scoring (QCS) data for the sites across their business via the My NHBC Portal. This data provides a new level of insight and visibility of quality across sites or by region. The scoring data will show, by key stage, which inspections are compliant (right first time), which are good quality (beyond compliance) and which are poor quality (of concern and need addressing), helping to manage consistency and identify areas of focus.
Quality Common Scoring has been a real fundamental change through the Technical Risk Management project and one which I got very excited about early on. To have a simple 1 - 6 score throughout multiple areas makes things much simpler and consistent.

Reportable Items
If Reportable Items are found during an inspection, a score of 1, 2 or 3 is automatically recorded based on the cumulative total of the Damage Potential Rating of each Reportable Item in that inspection. If no Reportable Items are found, a score of at least 4 will be given with a 5 or 6 being possible for very good or outstanding quality of work.

Damage potential rating
Damage potential rating is a pre-determined weighting applied to each Reportable Item depending on the severity of the item. It is based on claims potential, health and safety, Building Regulations and homeowner disruption.

Recording scores
NHBC Building Inspectors record the score for each Key Stage Inspection on the matrix page in the Site Record Book and discuss scores with the site manager at the end of each visit.
Example report
A PDF is available giving more detail about the scoring scale.
Example scoring data
The chart below shows how the range of scores can be reviewed for each of the key stage inspections of houses using the raw data made available to you.
- The shades of blue and green represent compliant inspections (e.g. Pre-handovers are below 70% compliance)
- The shades of green represent quality that exceeds compliance
- The shades of red represent poor quality, where multiple or serious issues were identified.
Reviewing the data in this way helps to build a picture of the areas of strength and weakness.

Technical risk management tools
We work together with you, on a bespoke site-by-site basis, from pre-construction to post-completion to help you identify and manage the technical risks on your sites. Below, we explain some of the key tools we use to support you.

Bespoke Technical Risk Management Plan
This document records the bespoke approach we will take to mitigate the risks of defects and improve quality across the site. It will highlight risks that might require extra inspections, extra meetings and/or photographic evidence.

Joint Virtual Meetings
These are meetings between the site manager, members of the builder’s technical team and our technical specialists. The attendees and frequency of meetings will vary depending on the complexity of the site.

Quality Benchmark Report
Produced for each Key Stage Inspection and where required, any additional Risk Based Inspection stages, this report will provide photos and commentary, a score of 1-6 and will highlight good practice and defects.

Technology Assisted Inspections (TAI)
This functionality allows you to upload geotagged photographs for online inspection or re-inspection by our team, sometimes avoiding the need for an inspection visit.