Extensive data catalogue
Data from 2007 across registrations, starts and completions, with detailed breakdowns that will aid your analysis for business planning and forecasting.
Get the most up-to-date statistics to support your strategic planning.

Our self-service data portal gives you unparalleled access to the most in-depth residential construction information. Our Building Inspectors carry out around one million inspections each year, gathering data on a plot basis to help track the pace of construction including:

Data from 2007 across registrations, starts and completions, with detailed breakdowns that will aid your analysis for business planning and forecasting.

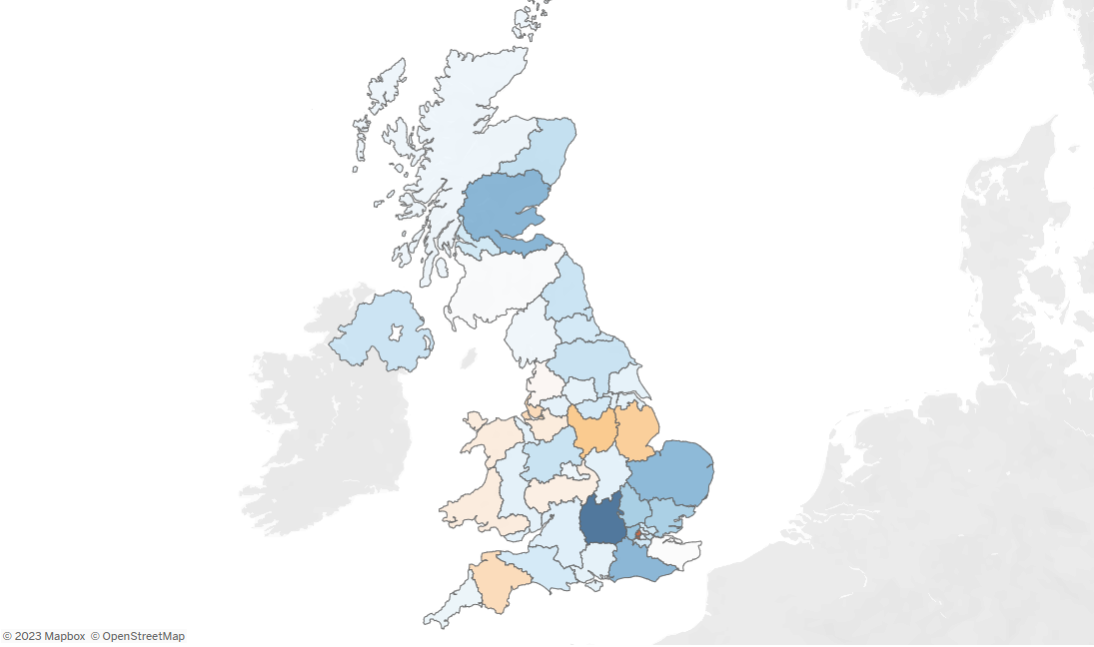
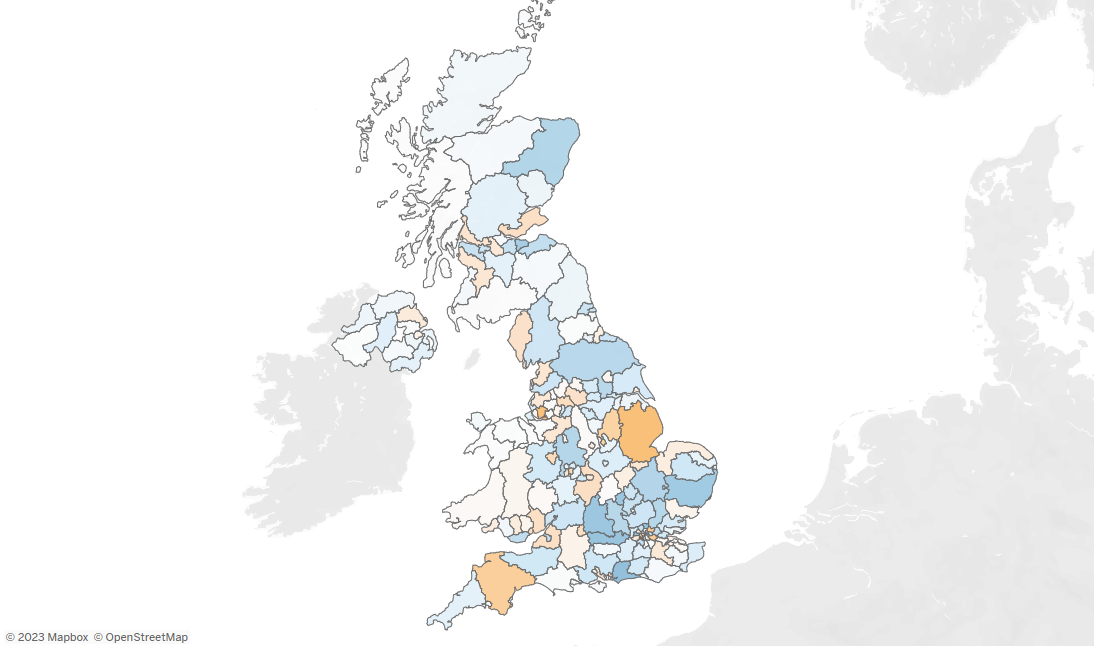
Drill down by location, from national level, down through UK International Territorial Level (ITL) groupings 1, 2 and 3 (over 170 regional areas).

Automatic data refreshes make the most recent data available at the start of each month or week.

Customise your preferred reports with data tables, charts and maps for quicker access.

Extract the information you need directly into Excel, PDF or PowerPoint saving you time in creating your reports.

Discount for additional user licenses relieves one point of contact responsibility.
A 75% discount is available on additional RCS subscriptions for businesses. This discount applies to additional users within the same company who subscribe to the same RCS access level or a lower access level than the primary subscription.


International Territorial Levels (ITLs) are a standard for referencing the geographical sub-divisions of the UK for statistical purposes, used by the Office for National Statistics (ONS). ITL 2 divides the UK into about 40 areas with population ranges between 800,000 and 3,000,000. ITL 3 is even more detailed, dividing the UK into over 170 areas with population ranges between 150,000 and 800,000. The next review of ITLs by the ONS is scheduled to be in 2024. More information on ITLs.
NHBC has the broadest market share of UK new build construction. Information is gathered directly from developers and builders, and by over 300 inspectors visiting sites and homes regularly throughout construction. You can rely on NHBC data because it underpins our insurance and technical risk management processes and is critical to our business.
NHBC’s proprietary data is available to you at three subscription levels. Data can be shared within your organisation for internal use. Each licence provides a login to the platform for a single user. Discounts are available for multi-user and multi-year subscriptions. Please enquire below to discuss your organisation’s needs.
Yes, exports of data are available in both CSV (comma separated variable text files) or in Excel format. In addition, visuals (e.g. charts) can be easily exported as an image, PDF or PowerPoint.
All data in Residential Construction Statistics is aggregated. Our Pro package, which includes weekly ITL-3 data, offers the most detailed view.
Each user can create personal custom views that save their filters, sorts, drill-downs or selections, making them available at the click of a button. Custom views can also be made the default view for each tab. In addition, a user can choose to subscribe to a report or custom view. Subscriptions email an image or PDF snapshot of a view or workbook at regular intervals.
The data can be segmented by year, quarter, month, or week, depending on your subscription. Geographical breakdowns are provided for the UK countries, as well as International Territorial Levels (ITL) 1, 2, and 3. Additionally, all subscription packages provide access to breakdowns of registrations, starts, and completions by sector, dwelling type, construction type, and developer size. The data includes absolute home figures, percentages within a specific date range or geography, and mean or median proposed and actual selling prices.
Yes, we also offer bespoke reporting to suit your data needs. For more information and to enquire about this service, click here.
No, there is no automatic subscription after taking a free trial. You do not need to remember to cancel. Your trial access expires after seven days.

Seamlessly integrate your data with our real-time residential construction insights and house-building statistics, enabling you to make informed decisions about your business's health and strategy.
Learn more

For builders seeking to understand their customers' experience in their new home. Comprehensive housing market data, with large-scale surveys to measure homeowner satisfaction.
Learn moreIf you have an account for Residential Construction Statistics, please log in.